The diagnostic built for the way restaurants actually run.
Plug in any POS, inventory, or staffing data (e.g. Toast, Square, DoorDash). Gnomon analyzes seven sides of your business in parallel, talks to you about what it sees, and shows you exactly where you're losing money and where AI can actually help.
Three phases. One clear picture of your restaurant.
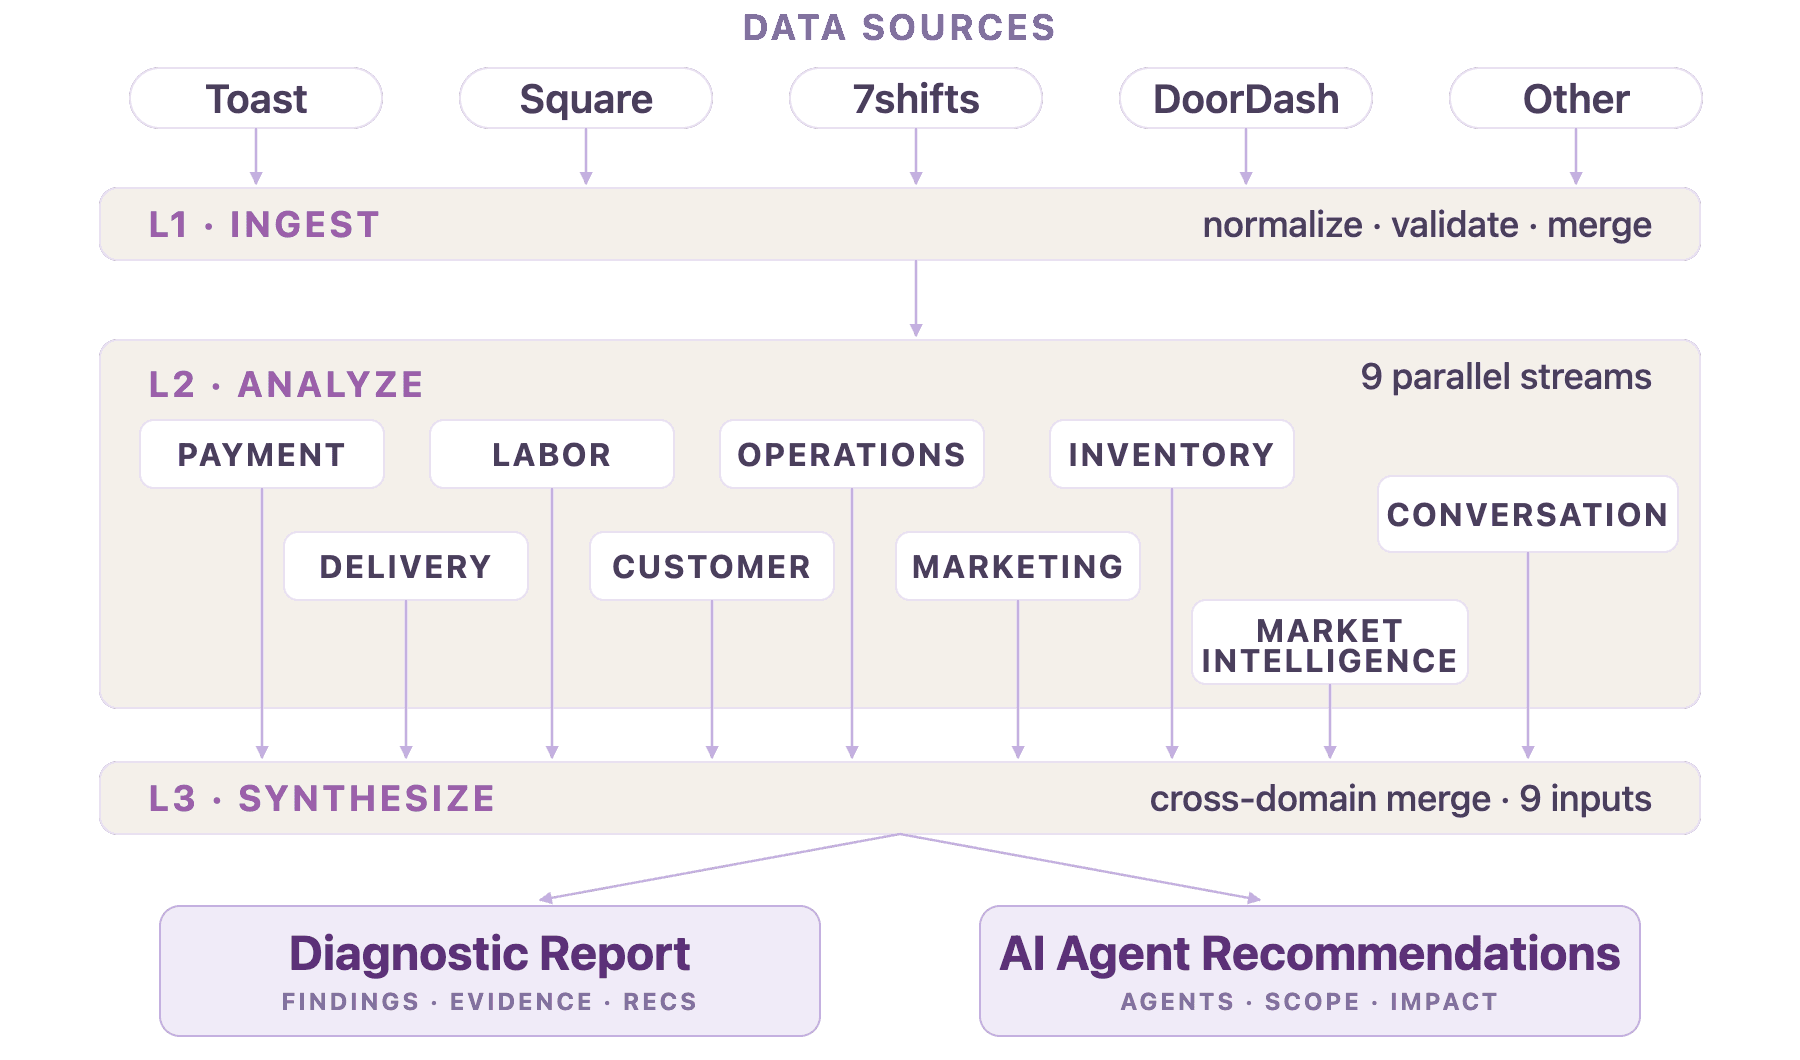
The Restaurant Pipeline runs a structured, three-phase diagnostic that combines your raw data, a real conversation with you, and outside benchmarking to produce findings you can actually trust.
Ingest & Get to Know You
Your POS, scheduling, inventory, or delivery data gets normalized into a clean, unified picture of your restaurant. While that's happening, Gnomon kicks off an exploratory conversation. No findings yet, just understanding your business in your words.
Seven Data Specialists Analyze in Parallel
Seven data specialists look at your business from different angles: payments, labor, ops, inventory, delivery, customers, and marketing. At the same time, Gnomon gathers external market intelligence and comes back to you with targeted questions about what it found.
Synthesize & Deliver
Everything (the specialist findings, your interview answers, the market benchmarks) gets merged into one diagnostic report. You see what's wrong, why the data suggests it, and which AI agents we recommend you use to fix it.
The tools you already use.
You don't switch systems. You don't change anything about how you operate. You just connect the platforms running your restaurant today, and Gnomon takes it from there.
These are just the most common stacks we see. Gnomon can ingest data from any system you already use, whether it's a different POS, a custom spreadsheet, your bookkeeping software, or something else entirely. If you have it, we can normalize it.
Data alone doesn't know your restaurant. You do.
Halfway through the analysis, Gnomon comes back to you. Not with a generic survey, but with specific, targeted questions about what it just found. A spike in voids on Tuesday afternoons. An overtime pattern in your kitchen. A drop in repeat customers after July.
You answer in your own words. Gnomon turns those answers into structured findings that get weighted alongside everything the specialists discovered. The result is a diagnostic that reflects both the data and your judgment as the operator.
Seven angles. Seven data specialists.
Restaurants don't break in one place. They leak across payments, labor, inventory, and delivery, all at once. So Gnomon runs seven data specialists in parallel, each one looking at a different side of your business with deterministic logic first and AI interpretation second.
Looks at how money moves through your business: transaction patterns, refunds, voids, comps, and processing fees.
Cross-references your schedule against actual sales volume to find where you're overstaffed, understaffed, or paying for inefficient coverage.
Looks at the rhythm of your restaurant: peak hours, slow periods, throughput, and where the daily flow breaks down.
Connects what you sell to what you stock. Surfaces waste, over-ordering, menu items that don't pull their weight, and items quietly draining margin.
Audits your third-party delivery economics: prep time, order accuracy, fee structure, and whether DoorDash is actually making you money.
Studies your guest behavior: repeat patterns, ticket sizes, time-of-day preferences, and where loyalty quietly slips through the cracks.
Looks at how visible your restaurant is, what's working in your channels, and how you compare against neighbors in review sentiment and reach.
Your numbers compared to the restaurants around you.
Internal data only tells half the story. Gnomon pulls in external benchmarks: the competitors on your block, what guests are saying about them, and how your neighborhood is performing.
Three ways to use what Gnomon finds.
Every diagnostic that comes out of the Restaurant Pipeline ships with three outputs. A static report you can share, a living dashboard you can navigate, and a deep-dive view for when you want to understand exactly why a finding is on the list.
Diagnostic PDF Report
A polished, shareable PDF summarizing every finding, opportunity, and confidence score. Send it to your accountant, your partner, your investors, or hold onto it as a record of where your restaurant stood.
Live Dashboard
Your key takeaways, top bottlenecks, and prioritized AI opportunities, all in one view. Built for the operator who wants the headline answer first and the details when they need them.
Click-In Deep Dive
Click any finding to see the full story behind it: the data points that triggered it, the specialist reasoning, your interview answers, and the recommended AI agents to address it.